Update:
OnBalance & HiPriority are now legacy products and are no longer available for download.
OnBalance
Our OnBalance
Decision Analysis software is used by leading
organisations to help make multi-million pound
decisions. It is used around the world and is praised
for its strong visual outputs and graphical interface.
After all, making finely balanced choices is hard enough
without having to worry about your modelling system:

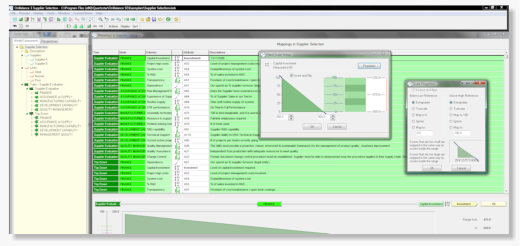
Setting up the scale mappings in OnBalance
OnBalance
is based on Multi-Criteria Decision Analysis (MCDA)
which helps separate what you measure from how you
value it. The interface is specifically designed for
group decision making,
as most of the difficult decisions
are between good schemes, each supported by one or
more managers.
So the problem is not so much about calculating the trade-offs as it is about stimulating the debate, focusing on one issue at a time, resolving and recording the agreements and then moving on. At each stage the group can see the impact of each change and gain confidence that their judgments are accurately reflected.

- Central menu bar with full access to all windows
- Intuitive Process Diagram to guide you through all the steps of the decision journey
- Window specific menus and toolbars to locate all actions easily
- Right-hand mouse clicks throughout to help you drill down when necessary
- 8 flexible mapping types
- Limits to benchmark the performance of Options
- Comments on the scores so that whenever there is uncertainty or dispute this can easily be captured
- A new import system allows mass transfer or easy cut and paste from web pages, spreadsheets, .CSV files, directly into the model
- What-if and stakeholder analyses through the
multiple weights sets that allow you to record
and explore differences in the criteria weights - Insightful robustness screen to identify the reasons behind the winner's performance and perform sanity checks
- Powerful sensitivity analysis to perform what-if analysis, identify the ranges of stability for each criterion and see the impact on the remaining criteria
- Results displayed as stacked bar charts with the overall value number overlaid
- Creation of custom screenshots (jpg) with one click from the outputs of OnBalance that can be used anywhere
HiPriority
HiPriority redefines the power and ease with which you can tackle Resource Allocation, Project Prioritisation and Design to best Value decisions. At its heart, a Benefit to Cost ratio is used to sort many possible options (projects/ objectives) into solutions, thus encouraging debate and choice amongst those involved so that the best portfolio can be found within the available budget.
HiPriority was the world's first product to allow accurate modeling of the consequences of interactions between options:
- Synergies are defined by modifying the effective cost or benefit of including two options in a solution
- Dependencies and Exclusions between options to avoid impossible combinations
- Multiple Buffers to see the effects of forcing options in (or out) of a solution
The combinations are endless but the powerful search
engine will always take them into account to find the
solutions with the greatest value. There are no behind
the scenes rules; every control is represented by a
visual object that can be inspected and modified in real
time. Any possible solution can be viewed within the
powerful inspection window, which allows immediate
visual analysis
and understanding of the changes:

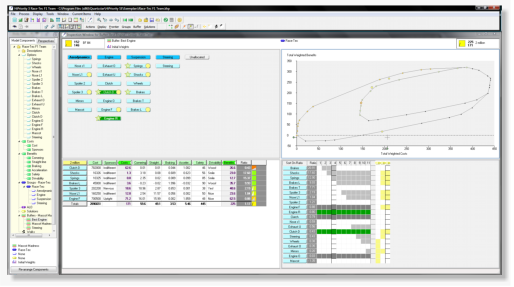
Viewing solutions and buffers in the HiPriority inspection window
Don't be daunted! All this power is delivered in an
intuitive build-and-display approach which makes the
software is easy to learn and use. But most importantly
recommendations are easy to convey to others not present
in the group decision making event.
Who can Benefit?
When you can't see the wood from the trees...
HiPriority
can be particularly beneficial for Group decision
making, where the transparency and intuitive display
enable each stakeholder to see the full picture.
Examples of effective use include:
- CEO needing to provide strategic direction to their organisation
- Departmental Manager with budgeting decisions
- Project Manager in need of prioritisation solutions
- Product Manager wishing to build a leading portfolio
- Engineer interested in design of machines
Because HiPriority
helps focus attention on the most efficient solutions,
it can be of benefit to anyone with a decision of
considerable complexity.
HiPriority
provides a solution giving the optimal portfolio within
a given cost (e.g. budget, time) while taking into
account the differing views of interested parties.
Even those with little or no knowledge of MCDA can
feel comfortable and confident with the easy to use
interface of HiPriority.
Training, support and tutorials are always available
depending on your needs. Whereas most people take
advantage of this, we have some clients who picked it up
with very little, if any, training.

- Central menu bar with full access to all windows
- Intuitive Process Diagram to guide you through all the steps of the decision journey
- Window specific menus and toolbars to locate all actions easily
- Right-hand mouse clicks throughout to help you drill down when necessary
- What-if and stakeholder analyses through the multiple weights sets that allow you to record and explore differences in the criteria weights
- Inspection window that simultaneously shows each solution from 4 different perspectives
- Multiple groupings for the options to provide a new viewpoint of the proposed solution and stimulate debate
- High transparency of calculations allows the
inspection window to show effects in multiple
directions, thus improving confidence in solutions
- Ability to model interactions between options:
synergies, dependencies and exclusions
- At least one option constraint for Designs to
Best Value
- 8 flexible mapping types
- User defined solutions that clearly show the
relative strengths within the solution space
- Walks demonstrate the sub-optimal nature of
serial decision making and help construct recovery
plans from the status quo
- New text boxes that allow you to capture all the
detail and cross reference with external documents
- Comments on the scores so that whenever there is uncertainty or dispute this can easily be captured
- A new import system allows mass transfer or easy cut and paste from web pages, spreadsheets, .CSV files, directly into the model